Fill rate is on target. Order accuracy looks good. And yet total cost per case has crept up two months running, with nothing on the dashboard to explain it.
That’s the problem with the number executives watch most closely. Cost per case is a lagging indicator, the net result of labor rates, productivity, shipped volume, and hundreds of small decisions made on the floor every day. When it moves, it tells you something has changed. It can’t tell you what. And if volume simply dips in a slow month, it can rise even when the operation is running exactly as well as it was before.
Most operations have the same blind spot behind this. Floor supervisors track picks per hour and dock-to-stock times. Finance tracks cost per case. The two rarely meet on the same screen, so nobody can trace a cost problem back to the process that caused it, or prove that a process improvement ever reached the P&L.
A new white paper from Made4net and Keith Swiednicki International (KSi) closes that gap by connecting three layers: the floor, the dashboard, and the boardroom. Here’s the core of it.
Start with the instrument that keeps you level
Pilots flying in bad weather rely on an attitude indicator to keep the wings level when they can’t trust the horizon. In a distribution operation, that instrument is your paid labor productivity benchmark. Cost per case tells you the plane has moved. Productivity tells you which way it’s tilting.
Picking is where to look first. KSi benchmarking data shows selection consumes roughly 56% of all direct-labor hours, and travel alone can account for up to a third of selection time. Best-of-breed operators run nearly twice the productivity of the average. That spread is the size of the prize, and you find it by benchmarking each department against your own best results, not by averaging the whole building.
Put a dollar figure on every metric
“Pickers lost 6% of their shift to empty pick faces” sounds like a warehouse floor issue, one that might be overlooked or dismissed as a picker problem.
But “Empty pick faces cost us $4,100 last week” tells a different story. It turns an operational inefficiency into a business problem. The issue hasn’t changed, but putting a dollar value on it makes the impact clear, gets leadership’s attention, and creates urgency to address it.
The paper’s advice is to give every productivity KPI a cost twin. A metric with a dollar figure attached gets an owner. One without gets reported once and forgotten.
Know when a bad number isn’t a bad sign
Lagging metrics can look worse for reasons that have nothing to do with performance. When volume drops, fixed costs spread over fewer cases, and cost per case climbs even though the floor hasn’t slipped. The reverse is the opportunity: an automated operation with spare capacity can lower cost per case as volume ramps, improving cost and service at the same time.
Leading metrics need context too. On manual processes, inventory accuracy of 94 to 98% is normal. Real-time, scan-confirmed processes get top performers to about 99%. A warehouse at 96% on manual processes isn’t underperforming. Benchmarking it against a real-time peer is chasing an improvement that was never available to you.
Keep the KPI list short
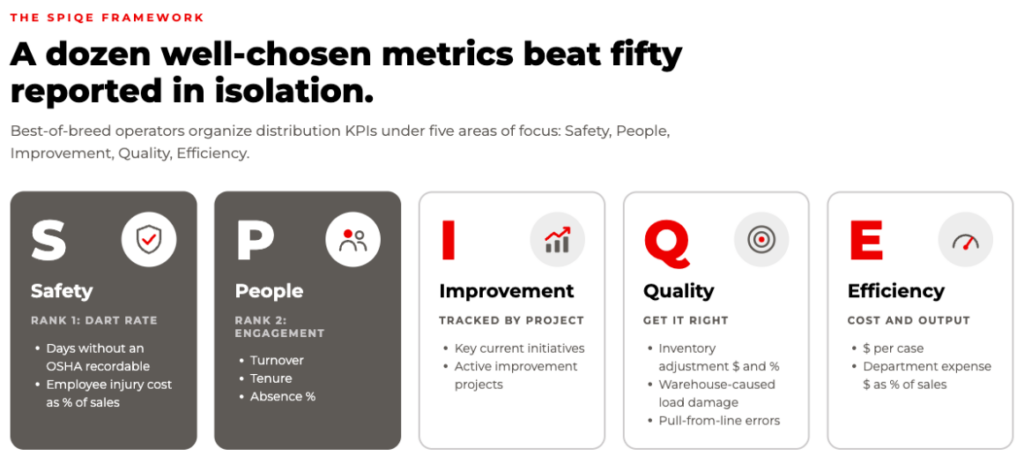
At the executive level, a dozen well-chosen metrics beat fifty reported in isolation. The paper organizes the short list under SPIQE, the framework best-of-breed operators use: Safety, People, Improvement, Quality, Efficiency. Safety and people rank first for a reason. An injury, or a floor that turns over every six months, undermines every productivity number beneath it.
And none of it works on stale data. The harder question isn’t whether you track these metrics, it’s whether anyone can act on them during the shift, not in a report that’s two weeks old. A warehouse management system that captures every transaction as it happens turns the three layers into a working system instead of a monthly review.
Go Deeper
The full paper: From Floor to Boardroom: The Warehouse KPIs That Matter, and How to Read Them includes the metrics to track at each stage of the warehouse, the roll-up from floor to boardroom, five practices for reading KPIs well, and a benchmark reference table so you can see where your own numbers should sit.