The shift happening in DC metrics
Warehouses are executing well. That’s not really in question. What’s changed is what leadership is watching, and how fast the priorities are moving.
Every year, WERC (Warehousing Education and Research Council) produces the DC Measures Annual Survey and Report on Industry Metrics. For three straight years, cost reduction has topped the list of DC objectives, with 48.6% of respondents citing it as their top goal this year, the highest share in five of the past seven. That single data point tells you something important: the metrics that mattered in 2023 aren’t necessarily the ones that matter now, and operations that haven’t updated their playbook may be measuring and executing on the wrong things.
In this guide we’ll look at what’s shifting in four key categories, why it’s shifting, and what to actually do about it.
Category 1: Inbound accuracy and dock-to-stock speed
What’s being measured. Two inbound metrics moved sharply this year: dock-to-stock cycle time climbed from #5 to #2, and the percentage of supplier orders received with correct documentation jumped from #30 to #8. Both point in the same direction, toward the receiving dock.
Why it’s shifting. The math is simple once you see it. A documentation error caught at receiving is cheap to fix. A mispick or backorder caught further downstream, at the shelf or at the point of shipment, costs far more, in labor, in customer satisfaction, in the rework nobody budgeted for. Facilities under real cost pressure are realizing that quality control belongs at the earliest possible point in the workflow, not layered on as damage control later.
What to do. Inbound can’t stay a back-office function. Start by looking at where documentation errors and receiving discrepancies actually originate, most operations have never mapped this precisely. Automated matching between purchase orders and what physically arrives removes a huge share of manual error. And if your WMS isn’t flagging discrepancies the moment a shipment hits the dock, that’s the gap to close first, before touching anything more ambitious.
As Renee Truttmann, CMO at Made4net, put it, “Operations that used to tolerate inbound variability are now treating receiving precision as a competitive advantage. The WMS has become the enforcement layer for that discipline, not just a record-keeping system.”
Category 2: Workforce stability vs. flexibility
What’s being measured. Turnover and cross-training rates, and the tension between them.
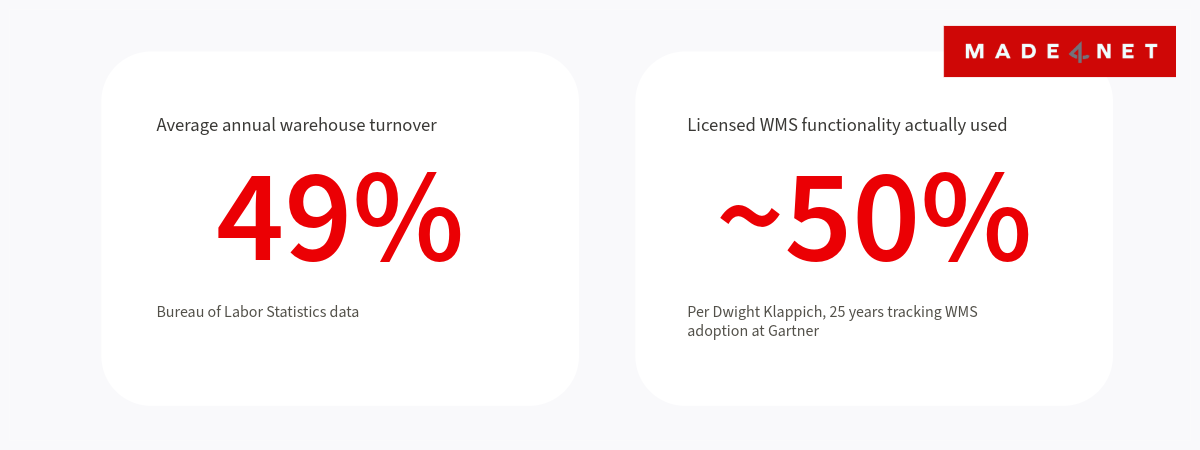
Why it’s shifting. Turnover remains a persistent problem across the industry, not a solved one. At a recent Made4net customer event, Dwight Klappich, who spent 25 years as a Research VP at Gartner tracking warehouse technology adoption, pointed to Bureau of Labor Statistics data showing average warehouse turnover running around 49% annually, a number more likely to climb than fall. Even the facilities that made real progress on retention weren’t spared the tradeoff: this year’s benchmarking data shows Best-in-Class facilities cut turnover by 36%, yet those same facilities saw a 16.1% reduction in cross-trained percentage. Stabilizing a workforce and keeping it versatile appear to be two different problems, and progress on one doesn’t carry over to the other.
Klappich’s read on why it’s a straightforward user experience problem, not a training problem. Workers go home to consumer software built around speed and simplicity, then come back to systems built for a different era. Initial training and ongoing cross-training are hard, slow, and expensive on outdated systems.
What to do. This is exactly where the retention-versus-flexibility tension becomes solvable rather than just observable. Guided workflows and intelligent task assignment change the math: when the system itself can guide someone through unfamiliar work in the moment, cross-training stops depending on tenure, formal certification cycles, or a supervisor’s availability to walk someone through it. That’s the piece that’s been missing. The retention gains warehouses have fought hard for can finally translate into real flexibility, because the system is doing part of the teaching.
Category 3: Strategy and execution alignment
What’s being measured. Whether a facility’s stated strategy, cost leadership, product innovation, customer service, actually matches what its teams prioritize day to day.
Why it’s shifting. This is where the data gets uncomfortable. Organizations that identify innovation as their primary strategy should, in theory, operate differently than cost-focused operations. Largely, they don’t. Daily priorities across strategy types look remarkably similar, with one clear exception: cost leadership organizations, where stated strategy and actual daily focus stay closely aligned. Everyone else says they’ll operate differently, then spreads its attention thin across the same handful of default priorities.
The consequence isn’t just internal friction. It shows up directly in technology ROI. A facility that presents itself as innovation-focused but runs day to day like a cost-cutter tends to scope down its technology investments, or abandon them, before they deliver value. As Truttmann explained, “A facility can have a world-class WMS configured to support an innovation roadmap, but if the organization’s daily decision-making is still driven by cost avoidance above all else, the system never gets used to its full potential. The gap isn’t a technology problem. It’s an alignment problem that shows up in how implementations get scoped and what capabilities never get activated.”
What to do. Before your next technology conversation, run a simple audit: pull your stated strategic priority and compare it against what your team actually optimized for last quarter. If there’s daylight between the two, that’s worth solving before adding new systems on top of an operation that’s already pulling in two directions. A WMS configured for cost efficiency and a WMS configured for innovation aren’t the same deployment, and trying to run one strategy through the other’s configuration is where a lot of unrealized technology value quietly disappears.
Category 4: AI readiness
What’s being measured. Not AI adoption itself, most operations aren’t there yet, but the baseline operational maturity that has to exist before layering AI on top of it.
Why it’s shifting. AI applied to a misaligned or poorly measured operation doesn’t fix the operation; it automates the dysfunction. At the same customer event, Klappich shared a number worth sitting with: the average WMS customer taps roughly half of the functionality they’ve already licensed. Task interleaving, wave planning, advanced slotting, labor management, these capabilities exist in most modern deployments and go untouched more often than not, either because implementation ran out of time and budget before those modules got switched on, or because the team never received the training to use them well.
What to do. Before evaluating any AI investment, take an honest inventory of what your current system can already do and where that capability sits unused. The operations getting the most out of AI right now aren’t the ones chasing the newest capability. They’re the ones that closed that gap first, got the fundamentals right, and only then let AI compound those gains.
The throughline
Four categories, one idea underneath all of them: before you add more, get more out of what you already have. That’s true of the WMS capability sitting unused in Category 4, and it’s just as true of the workforce experience in Category 2, a system that guides workers through unfamiliar tasks makes the most of the retention gains already fought for, rather than requiring a separate training investment on top. The same logic runs through inbound accuracy and strategy alignment: the highest-leverage move isn’t usually a new system or a new initiative; it’s closing the gap between what your current operation is capable of and what it’s actually doing.
Cost pressure isn’t going away. But chasing it without addressing inbound precision, workforce flexibility, strategic alignment, and system utilization is a short-term fix that creates longer-term drag. None of this replaces the value of a full benchmarking exercise. If you want the complete data set and methodology behind this year’s shifts in DC priorities, WERC’s 2026 DC Measures Report, “The Strategic Paradox: Aligning Strategy to Drive Innovation in a Cost-First Era,” is worth the read in full. It’s free for MHI members, and well worth requesting if you’re not.
If you’d rather talk through where your own operation stands against these four categories, schedule a call with one of our WMS experts and we’ll walk through it with you.